
Net revenue retention (NRR) is the share of recurring revenue you still earn from a group of existing customers after a period, counting upgrades, downgrades and cancellations, but not new customers. If customers who paid you $10,000 a month a year ago now pay $9,000, your NRR is 90%. Above 100% means existing customers alone are growing your revenue.
For a small self-serve SaaS, the figure most founders quote is misleading. The famous "100% or more" benchmarks come from larger B2B companies with expensive plans. In ChartMogul's data, the median company charging $10 to $50 a month keeps about 63% of its revenue after a year. This guide shows how to calculate NRR correctly, what a realistic number looks like at your price, and what actually moves it.
The NRR formula
Take the customers who were paying at the start of the period. Measure what they pay at the end. Divide by what they paid at the start.
NRR = (starting MRR + expansion − contraction − churn) ÷ starting MRR
- Starting MRR: monthly recurring revenue from the customers in your group on day one.
- Expansion: extra monthly revenue those same customers added: upgrades, more seats or usage, add-ons and price increases.
- Contraction: revenue they removed by downgrading, without leaving.
- Churn: revenue lost from customers in the group who cancelled.
Gross revenue retention (GRR) uses the same group but ignores expansion: (starting MRR − contraction − churn) ÷ starting MRR. It can never exceed 100%. GRR tells you how well you keep revenue; NRR tells you whether expansion makes up for what you lose. SaaS Capital calculates GRR per customer, capping each customer's current revenue at their earlier figure, so one customer's upgrade cannot hide another's downgrade.
A worked example
Suppose you start a month with $10,000 MRR. During the month, existing customers upgrade by $600, some downgrade by $200, and cancellations remove $500. You also sign new customers worth $1,500 a month.
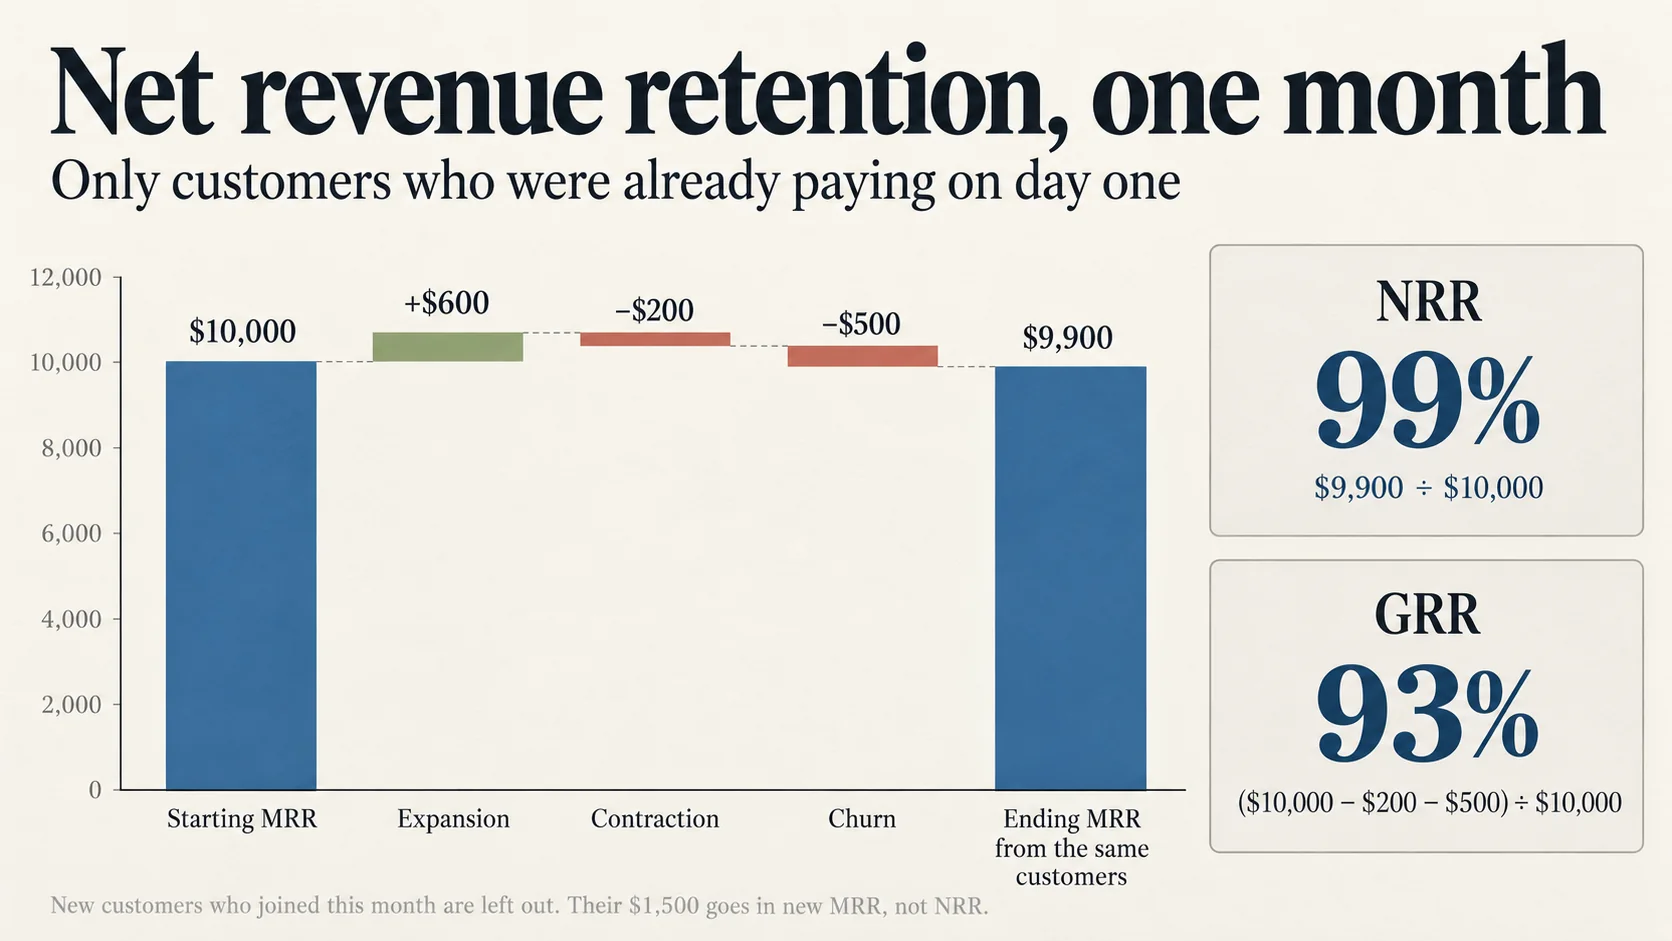
NRR = ($10,000 + $600 − $200 − $500) ÷ $10,000 = 99%. GRR = ($10,000 − $200 − $500) ÷ $10,000 = 93%. The $1,500 from new customers belongs in new MRR; it has nothing to do with retention. Your total MRR grew to $11,400, but the customers you started with are paying slightly less than before. Both facts matter, and NRR stops the first from hiding the second.
Measure it over a year, by cohort
The standard way to report NRR is annual: the revenue today from customers who were paying 12 months ago, divided by what that same group paid then. ChartMogul calls yearly figures the most popular because they cover the full renewal cycle, and most published benchmarks are annual.
Monthly NRR is useful for spotting problems early, but do not compound it into an annual number. SaaS Capital shows that 98% monthly NRR compounds to 78.5% a year, and that the result is "extremely sensitive to which two months you use". Churn is heavier among new customers, and annual renewals bunch up in particular months, so twelve monthly figures rarely multiply into the true annual one.
| Monthly NRR | Compounded over 12 months |
|---|---|
| 97% | 69% |
| 98% | 78.5% |
| 99% | 89% |
| 99.5% | 94% |
| 101% | 113% |
Treat the table as a rough warning, not a forecast: a small monthly loss becomes a large annual one. For a real annual figure, take your customer list from a year ago and add up what those exact customers pay today.
What is a good NRR for a small SaaS?
It depends mostly on your price. Benchmarks disagree because they measure very different companies, so compare yourself only with businesses like yours.
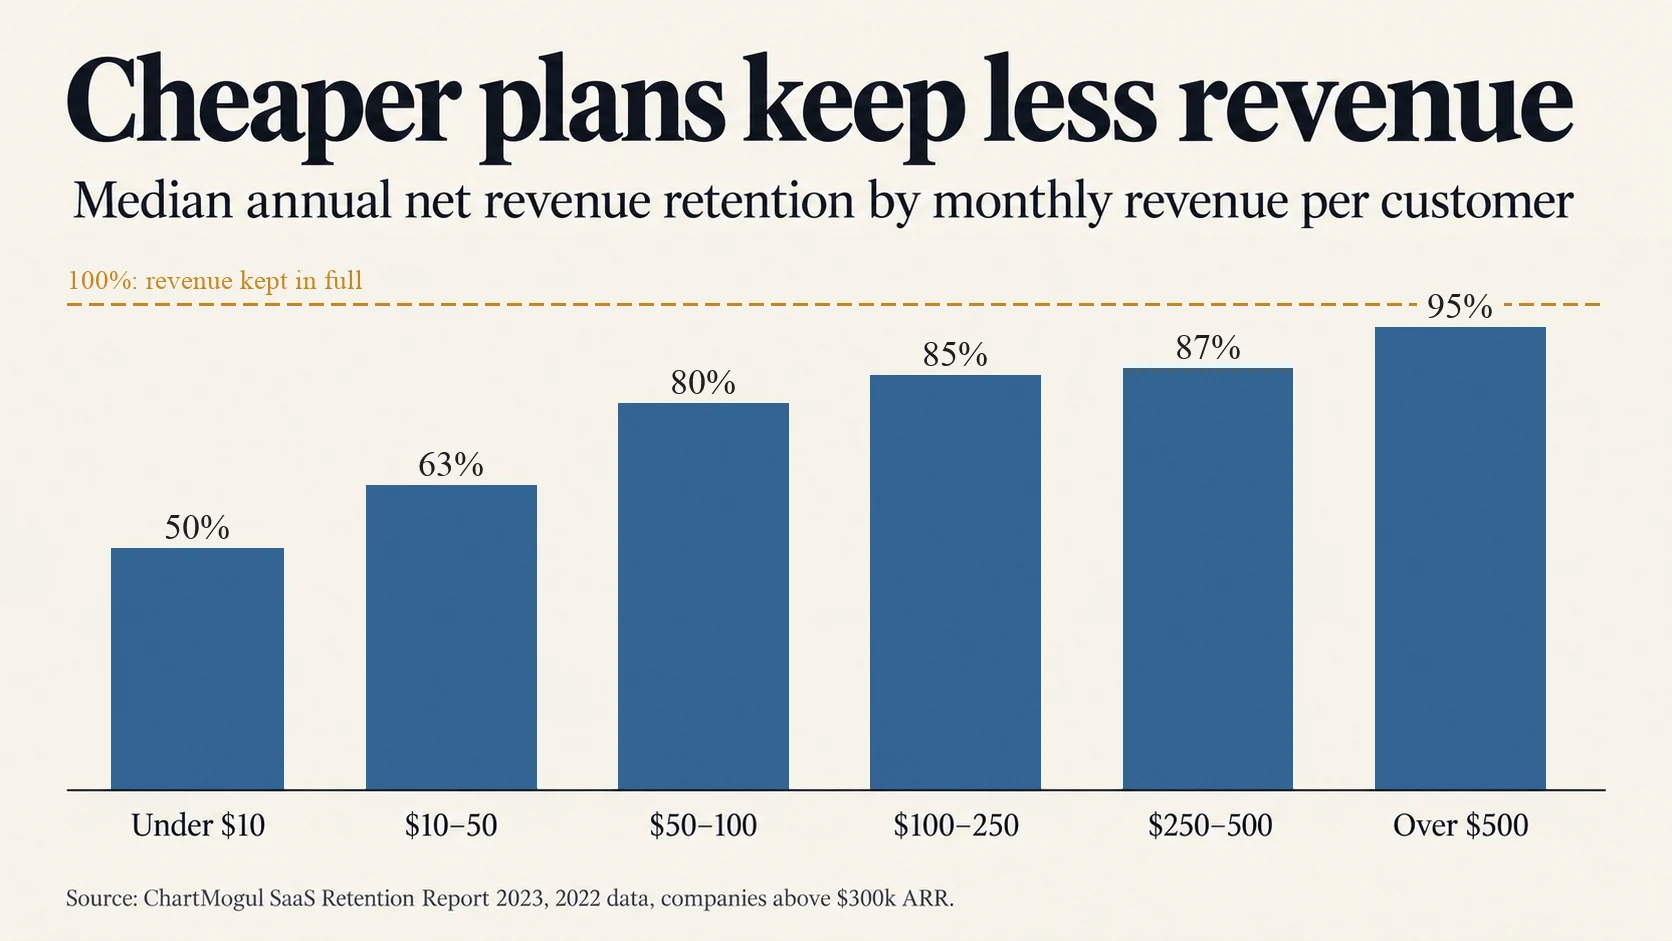
ChartMogul's data is the closest to a small self-serve SaaS. It is measured from billing data rather than surveys, and it includes low-priced products. Its 2023 retention report, covering 2022 and companies above $300,000 in annual revenue, found these medians by monthly revenue per customer (ARPA):
| Monthly ARPA | Median NRR | Top quartile | Share of companies above 100% |
|---|---|---|---|
| Under $10 | 49.5% | 65.1% | 2.7% |
| $10–50 | 62.7% | 79.5% | 4.1% |
| $50–100 | 79.5% | 91.7% | 13.8% |
| $100–250 | 85.3% | 96.7% | 19.5% |
| $250–500 | 86.8% | 101.3% | 29.8% |
| Over $500 | 95.3% | 109.3% | 41.1% |
ChartMogul's more recent report, The AI Churn Wave (December 2025), put the median B2B SaaS company at 82% NRR, with the top quartile at 97%, and the median consumer subscription business at 49%.
SaaS Capital's figures are higher because its companies are bigger. Its 2025 retention benchmarks surveyed more than 1,000 private B2B companies above $1 million in annual revenue and found a median NRR of 101% and GRR of 91%. For contracts under $12,000 a year, the median was 98% NRR and 90% GRR; bootstrapped companies reported 104% and 92%. These are useful targets for where a successful B2B product can get, not a grade for a $19-a-month tool with 80 customers.
A practical reading: if you charge under $50 a month, NRR well below 100% is normal, and keeping GRR up matters more than chasing expansion. At $100 or more a month, especially selling to businesses, 85% to 95% is a reasonable goal and 100% is achievable. Above $500 a month, aim for 100% or more.
What moves NRR in a small SaaS
Keep the revenue you have (GRR)
Low GRR drags NRR down faster than expansion can lift it. For a small product, that usually means fixing onboarding, failed payments and the reasons people leave. Our guides to a good churn rate for an early SaaS and reducing churn with only 20 customers cover that work in detail.
Offer annual plans
ChartMogul found that median NRR is 10 to 20 percentage points higher for annual plans than monthly ones. In its 2025 billing report, companies charging $250 to $500 a month had median NRR of 88% on annual plans and 76% on monthly plans. Part of that is selection, since committed customers choose annual, but a yearly commitment also removes eleven monthly chances to cancel. Our guide to annual versus monthly pricing covers how to offer both.
Build a way for customers to pay more
NRR above 100% requires expansion, and expansion requires somewhere to expand to. ChartMogul's 2023 report found expansion made up only 6.5% of new revenue for companies under $10 ARPA, against about 39% above $250. Its advice: check whether your pricing has an expansion loop. Options for a small SaaS:
- Tiers tied to growth in the customer's use: projects, contacts, seats, usage or locations, so a growing customer naturally moves up.
- Add-ons for heavier needs, such as extra storage, integrations or priority support.
- Price increases for existing customers, which count towards NRR but not GRR. Our guide on when and how to raise SaaS prices covers doing it without losing trust.
A useful check from SaaS Capital: the gap between GRR and NRR averages a little over 12 percentage points, and 8 to 20 points is normal. If your gap is under 5 points, your pricing has little room for customers to grow.
Common NRR mistakes
- Including new customers. New revenue belongs in growth, not retention. Only customers in the starting group count.
- Compounding a monthly figure and comparing it with annual benchmarks.
- Counting an annual payment as one month's MRR. Divide it across the 12 months it covers, as ChartMogul advises.
- Including one-time fees such as setup charges. NRR uses recurring revenue only.
- Using list prices instead of what customers actually pay after discounts.
- Letting currency swings count as expansion or churn. ChartMogul treats exchange-rate changes separately from real movement.
- Treating returning customers inconsistently. Tools differ on whether a returning customer counts; pick one rule and keep it.
- Trusting a young company's GRR. SaaS Capital notes that young companies show inflated retention because customers "haven't yet had a chance to churn".
Some reputable sources get the formula wrong too, for instance by adding expansion to an end-of-period total that already includes it. If a calculator gives you an NRR that looks too good, check whether it has quietly included new customers.
Small numbers need care
With 40 customers, a single cancellation can move NRR by two or three points, and one large customer upgrading or leaving can move it by far more. SaaS Capital leaves companies under $1 million in annual revenue out of its retention charts because of the small denominator. At an early stage:
- Use a trailing 12-month figure, and look at the trend over several quarters rather than one reading.
- Read the customer list behind the number: who expanded, who shrank, who left and why.
- Track GRR alongside NRR, so one large upgrade does not hide a steady leak.
- Calculate MRR consistently first; our guide to what MRR is and which number to watch and the MRR calculator help.
Does NRR affect what your SaaS is worth?
For large SaaS companies, strongly. For small ones, less directly. FE International, a SaaS broker, says businesses under about $1 million in annual revenue are usually priced on seller's discretionary earnings, typically 2.5 to 4 times, and that at that size NRR matters mainly as a signal of business health: buyers want a stable customer base that is not eroding. Acquire.com reported a median SaaS profit multiple of 3.9 times for deals on its marketplace in 2025.
So retention affects a small sale in two ways: buyers discount a business whose revenue is leaking, and strong retention makes profit more credible. If you plan to sell one day, our guide to selling a bootstrapped SaaS covers what buyers check.
A monthly NRR routine
- Export your customers and their MRR from your billing tool at the start of each month.
- Each month, calculate monthly NRR and GRR for last month's customers, to spot problems early.
- Each quarter, calculate annual NRR and GRR for the customers you had 12 months earlier.
- List every movement: each upgrade, downgrade and cancellation, with a reason where you know it.
- Pick one lever for the quarter: annual plans, an expansion tier or a churn fix. Then check whether the number moved.
NRR is most useful as a question, not a score: are the people who already pay you getting more value over time? For a small SaaS, a clear answer to that question is worth more than any benchmark.
FAQ
Questions people get stuck on
How do you calculate net revenue retention?
Take the MRR from customers who were paying at the start of the period, add their expansion, subtract their contraction and churned revenue, and divide by the starting MRR. Exclude revenue from new customers. For example, $10,000 starting MRR, plus $600 expansion, minus $200 contraction and $500 churn, gives an NRR of 99%.
What is the difference between NRR and GRR?
Both measure revenue kept from existing customers. NRR includes expansion from upgrades, add-ons and price increases, so it can exceed 100%. GRR excludes expansion, so it shows only how much revenue you keep and can never exceed 100%.
What is a good NRR for a small SaaS?
It depends on price. In ChartMogul's 2023 data, median annual NRR was about 63% for products charging $10 to $50 a month, 85% at $100 to $250, and 95% above $500. Larger B2B companies in SaaS Capital's 2025 survey had a median of 101%. Compare yourself with businesses at a similar price, not with enterprise benchmarks.
Should I measure NRR monthly or annually?
Report it annually, using the customers you had 12 months ago, because most benchmarks are annual and a year covers the full renewal cycle. Track it monthly as an early warning, but do not multiply twelve monthly figures to get an annual one.
Can NRR be above 100%?
Yes. If existing customers add more revenue through upgrades, seats, usage or price increases than you lose from downgrades and cancellations, NRR exceeds 100%. It is common among B2B products with higher prices and rare below $50 a month.
Do new customers count in net revenue retention?
No. NRR only measures customers who were already paying at the start of the period. Revenue from new customers is growth, and including it is the most common mistake in NRR calculations.